

 Rules & Institutions
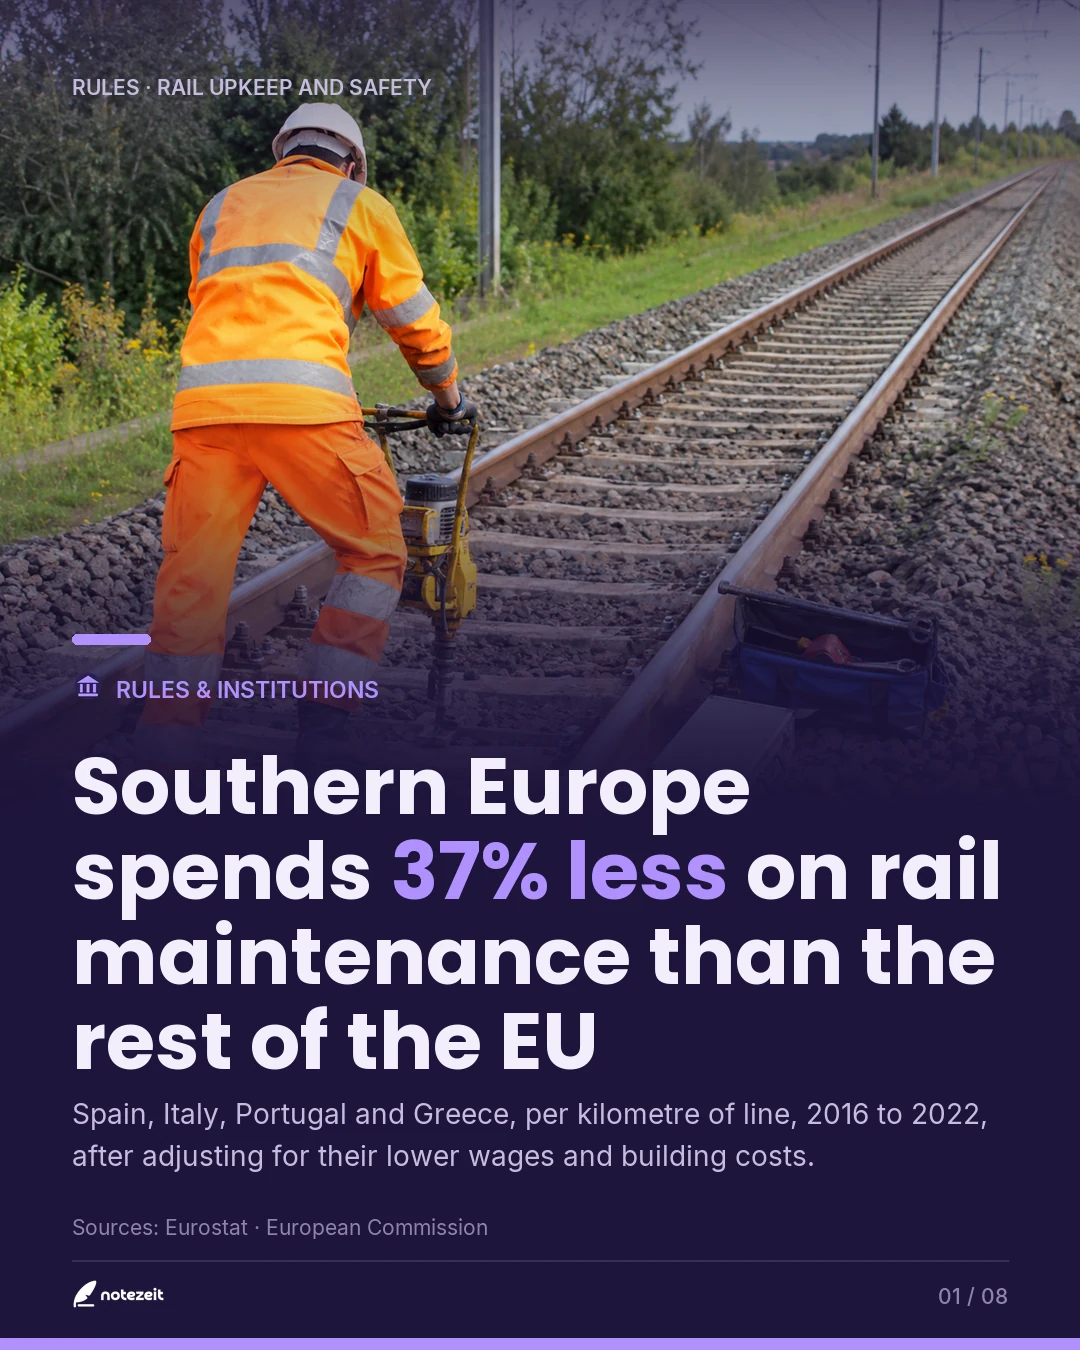
Southern Europe spends 37% less on rail maintenance than the rest of the EU
Spain, Italy, Portugal and Greece, per kilometre of line, 2016 to 2022, after adjusting for their lower wages and building costs.
The carousel
All 8 cards as they were posted. Scroll sideways to read them in order.
The caption
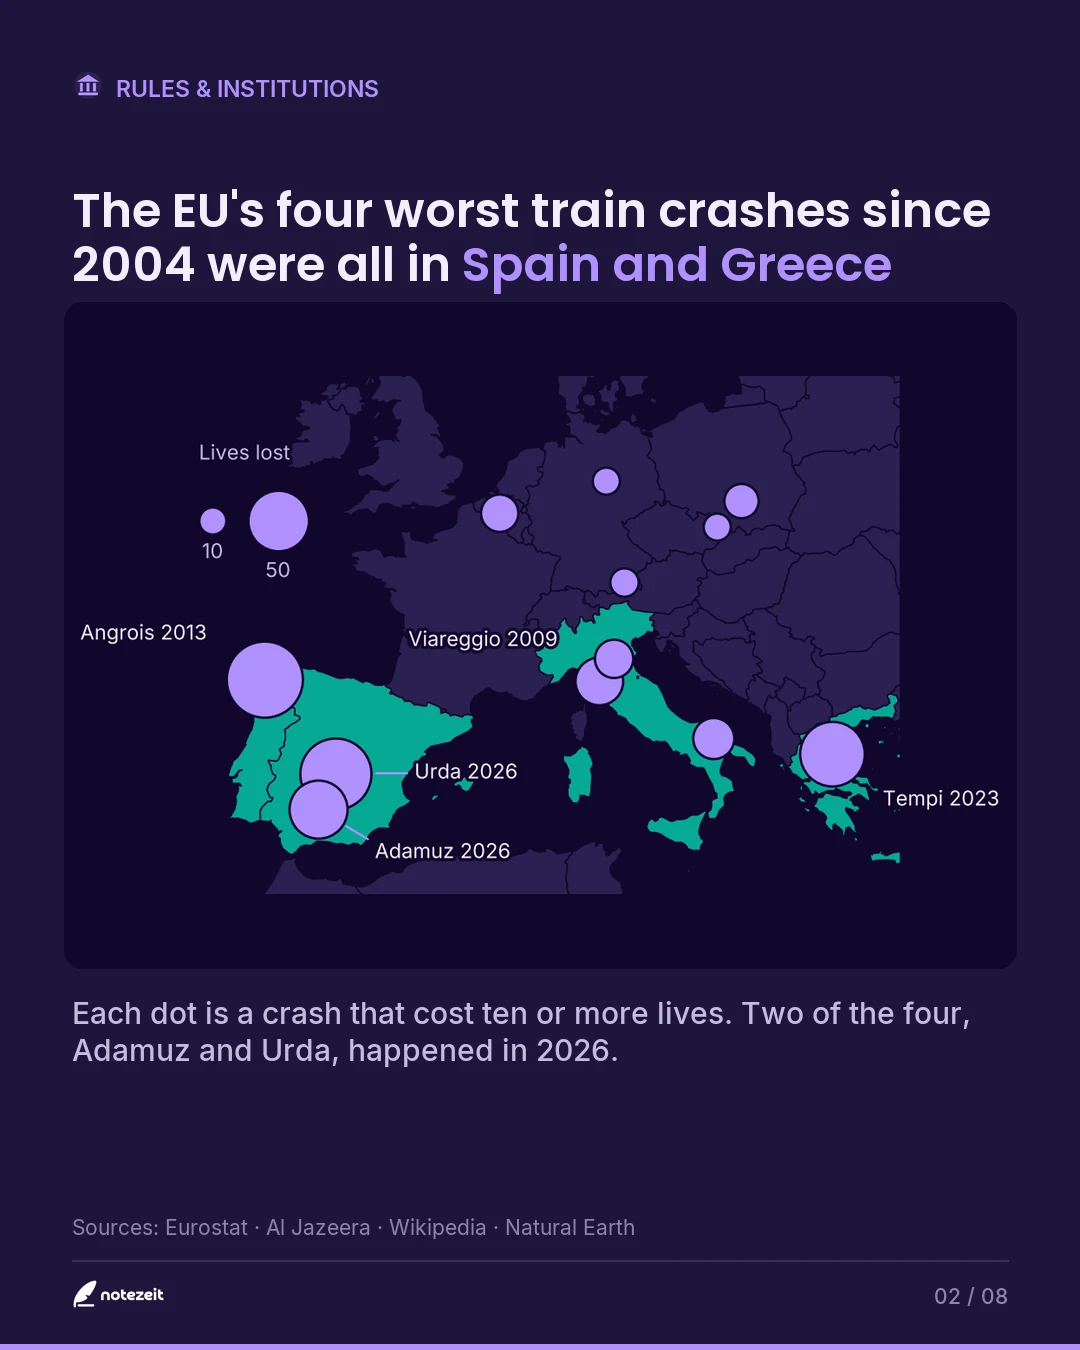
Spain has had three train crashes this year that cost lives. Urda cost 69, Adamuz 46 and Gelida one.
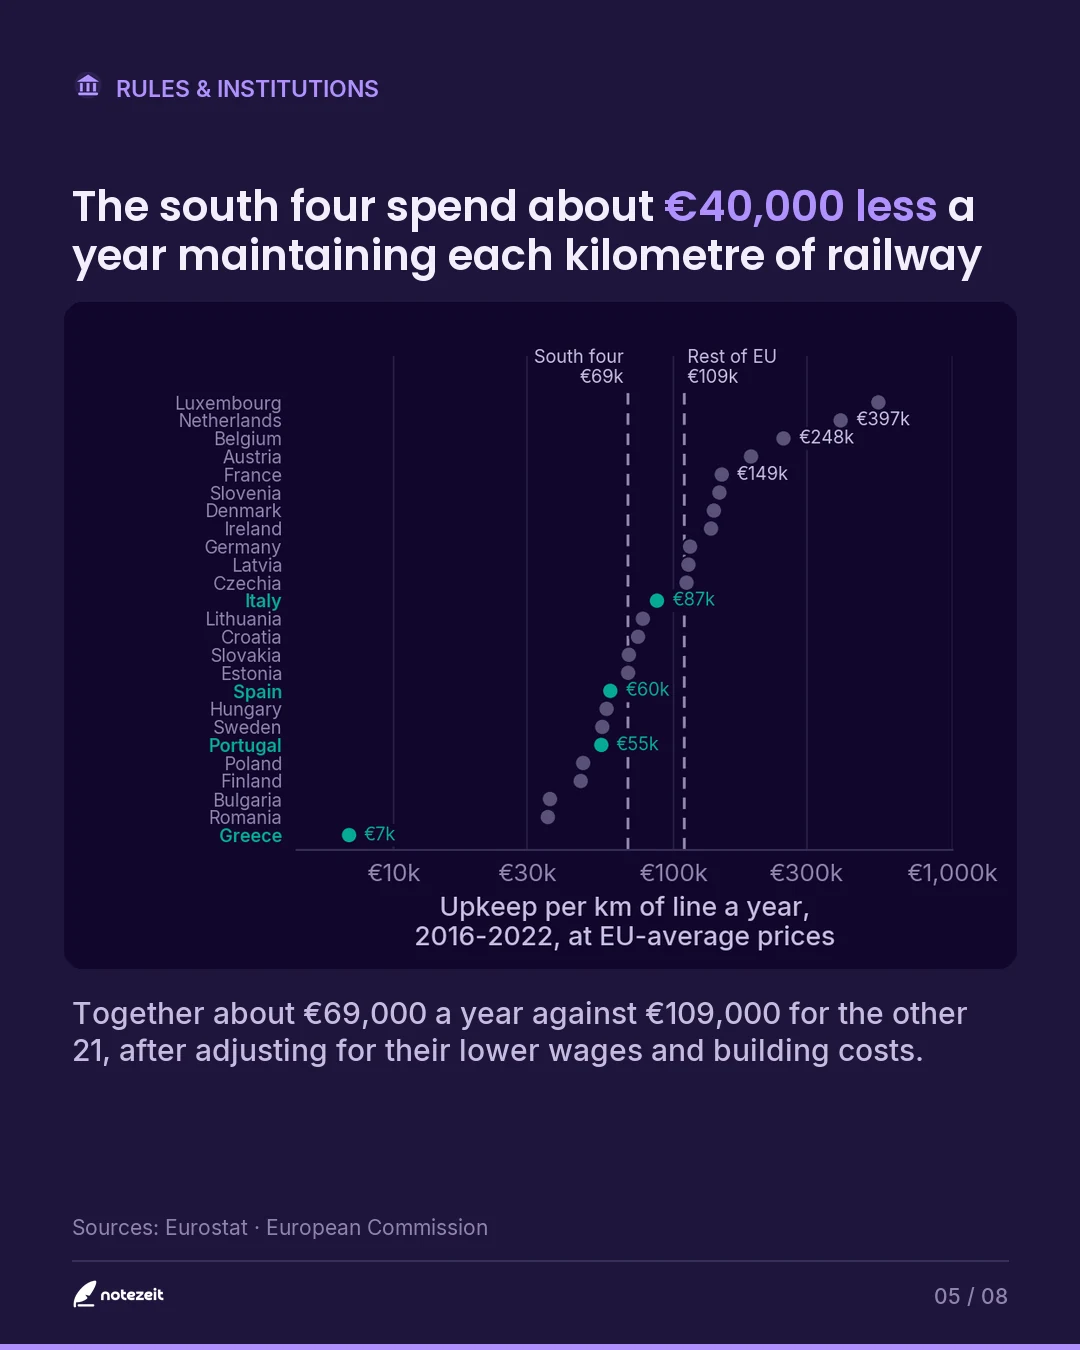
Does the north keep its railways in shape while the south pays in lives? We measured both halves. Across four years from 2016 to 2022, after adjusting for their lower wages and building costs, Spain, Italy, Portugal and Greece together spent about €69,000 a year keeping each kilometre of line in shape, while the other 21 EU countries spent about €109,000. The gap was there in each of the four years, even in 2022, the south's best.
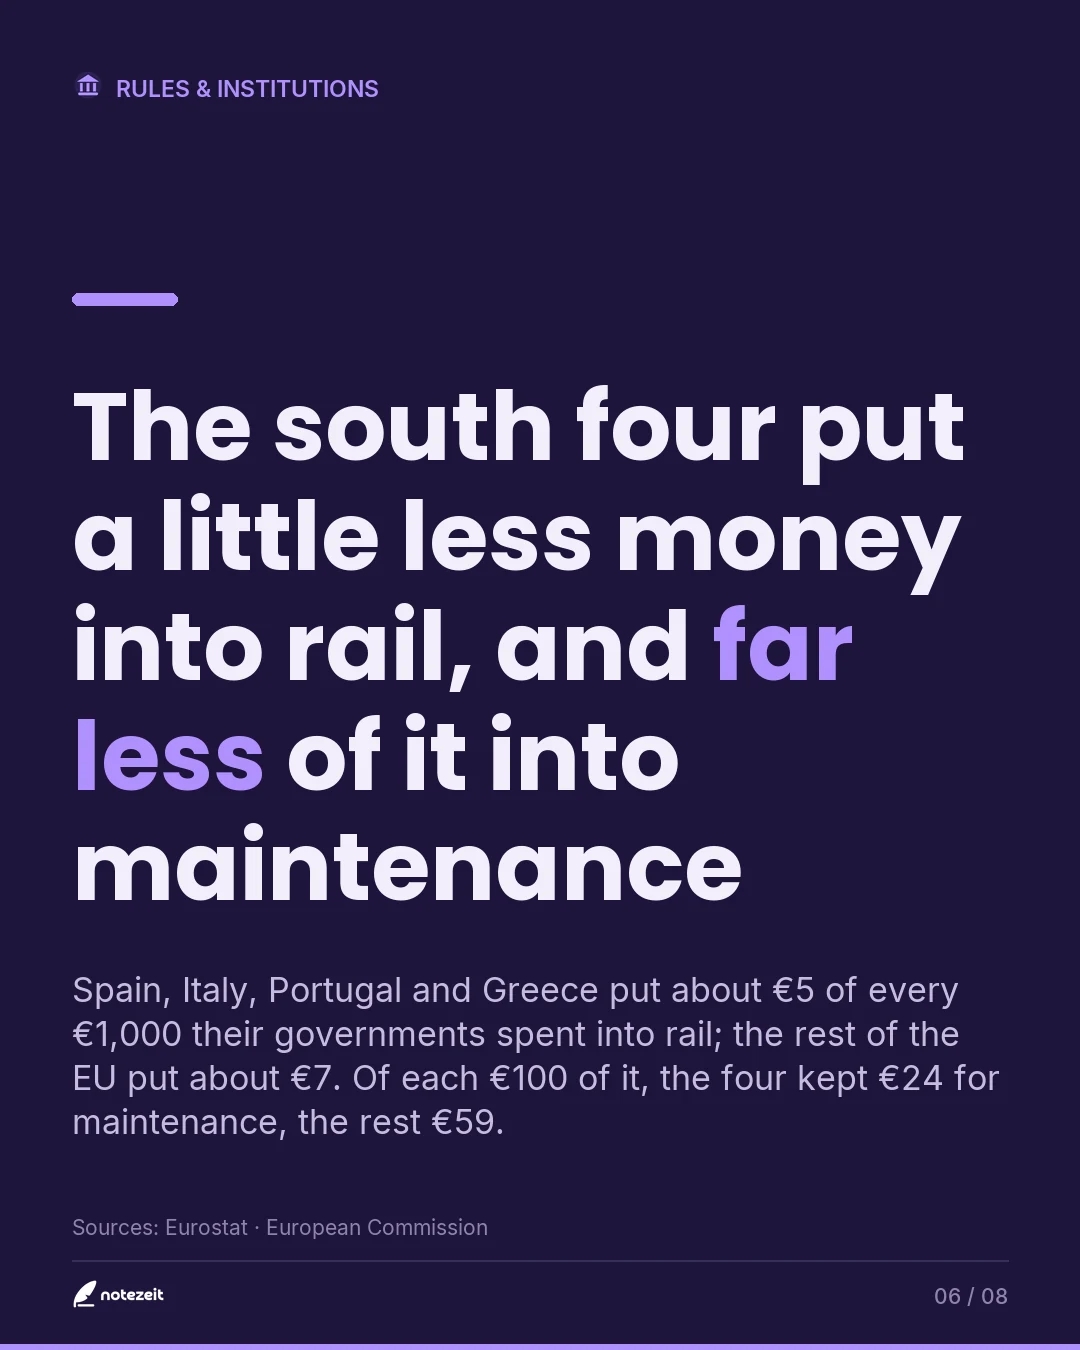
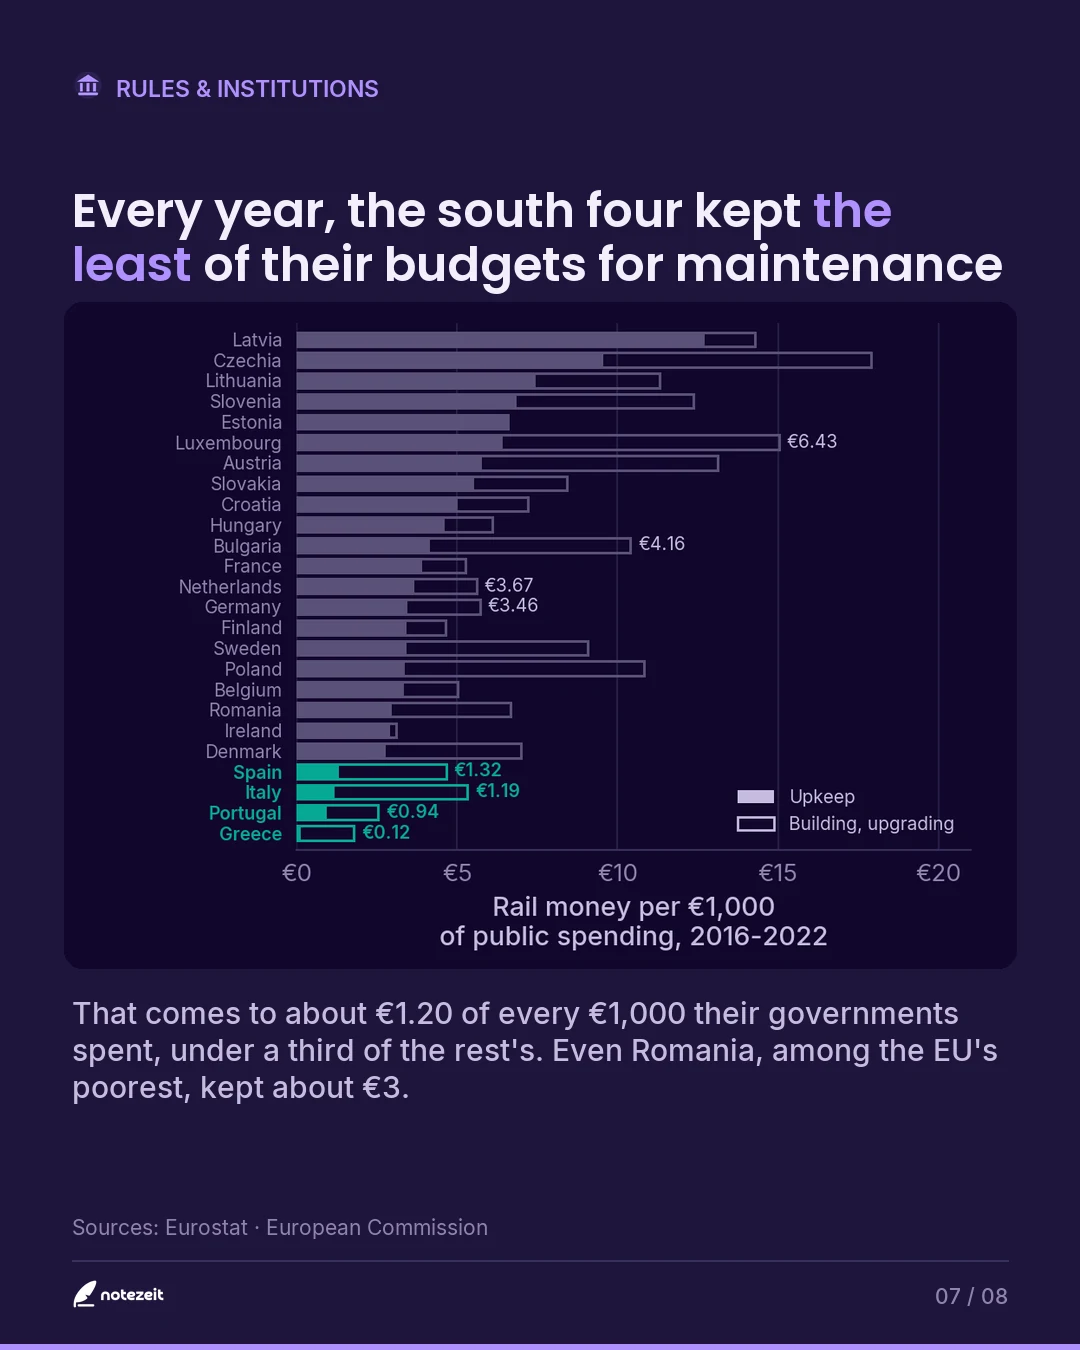
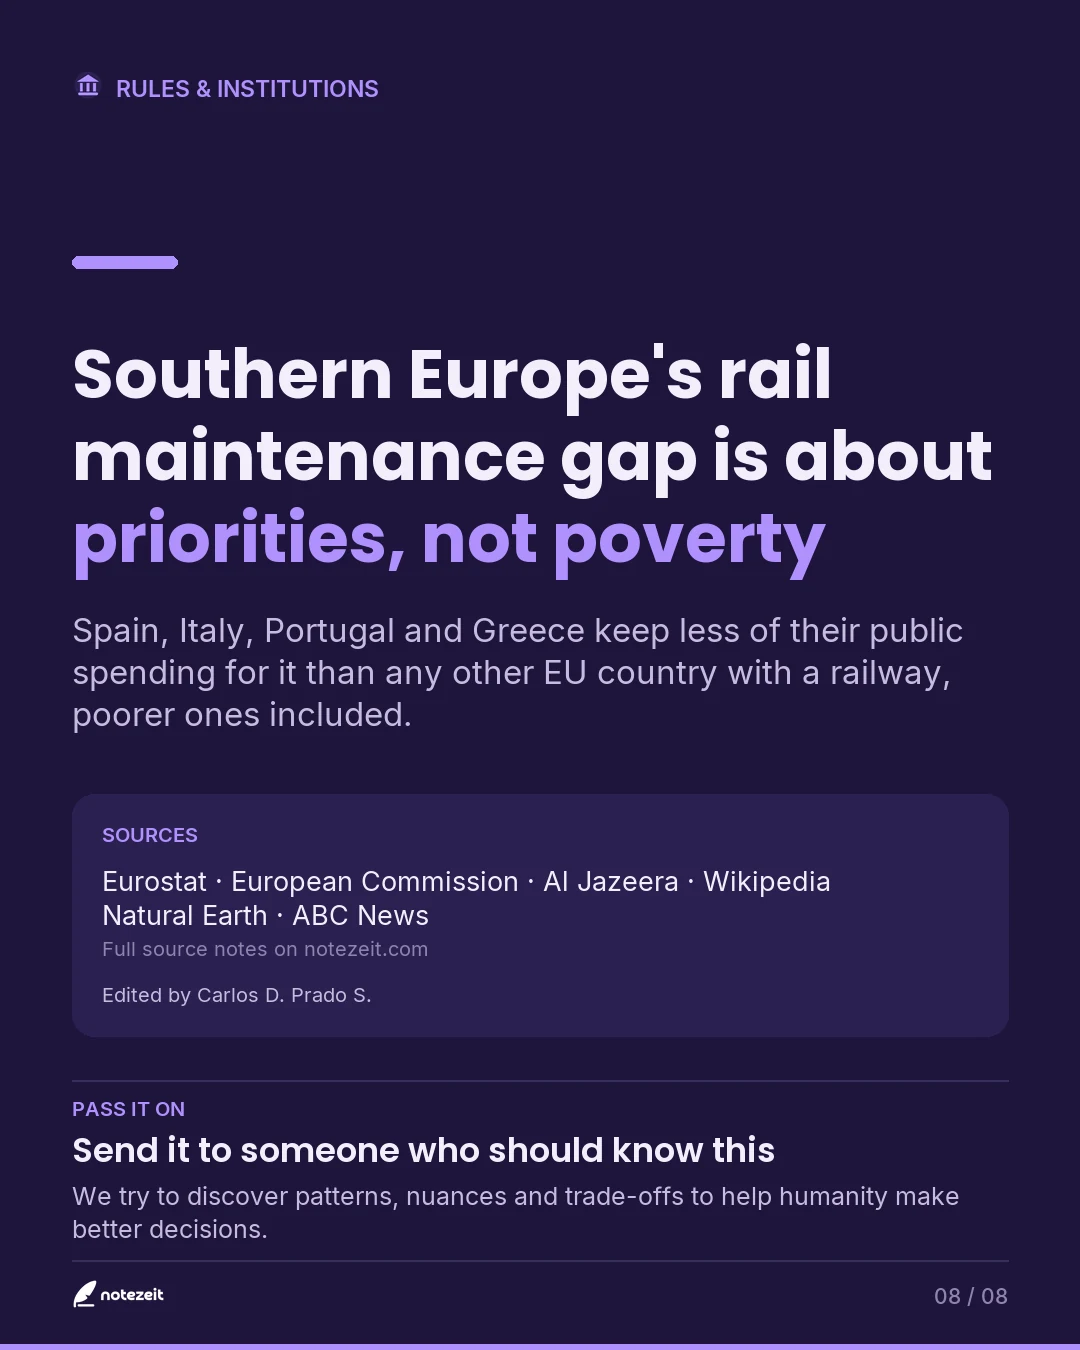
Is that just being poorer? Against their own budgets, not really. For every €1,000 their governments spent, they kept about €1.20 for rail maintenance, under a third of the rest's share, and in each of the four years no other EU country kept less. They put only a little less into rail, but far less of it into maintenance. Every eastern member, though poorer, kept more. The gap is about priorities, not poverty.
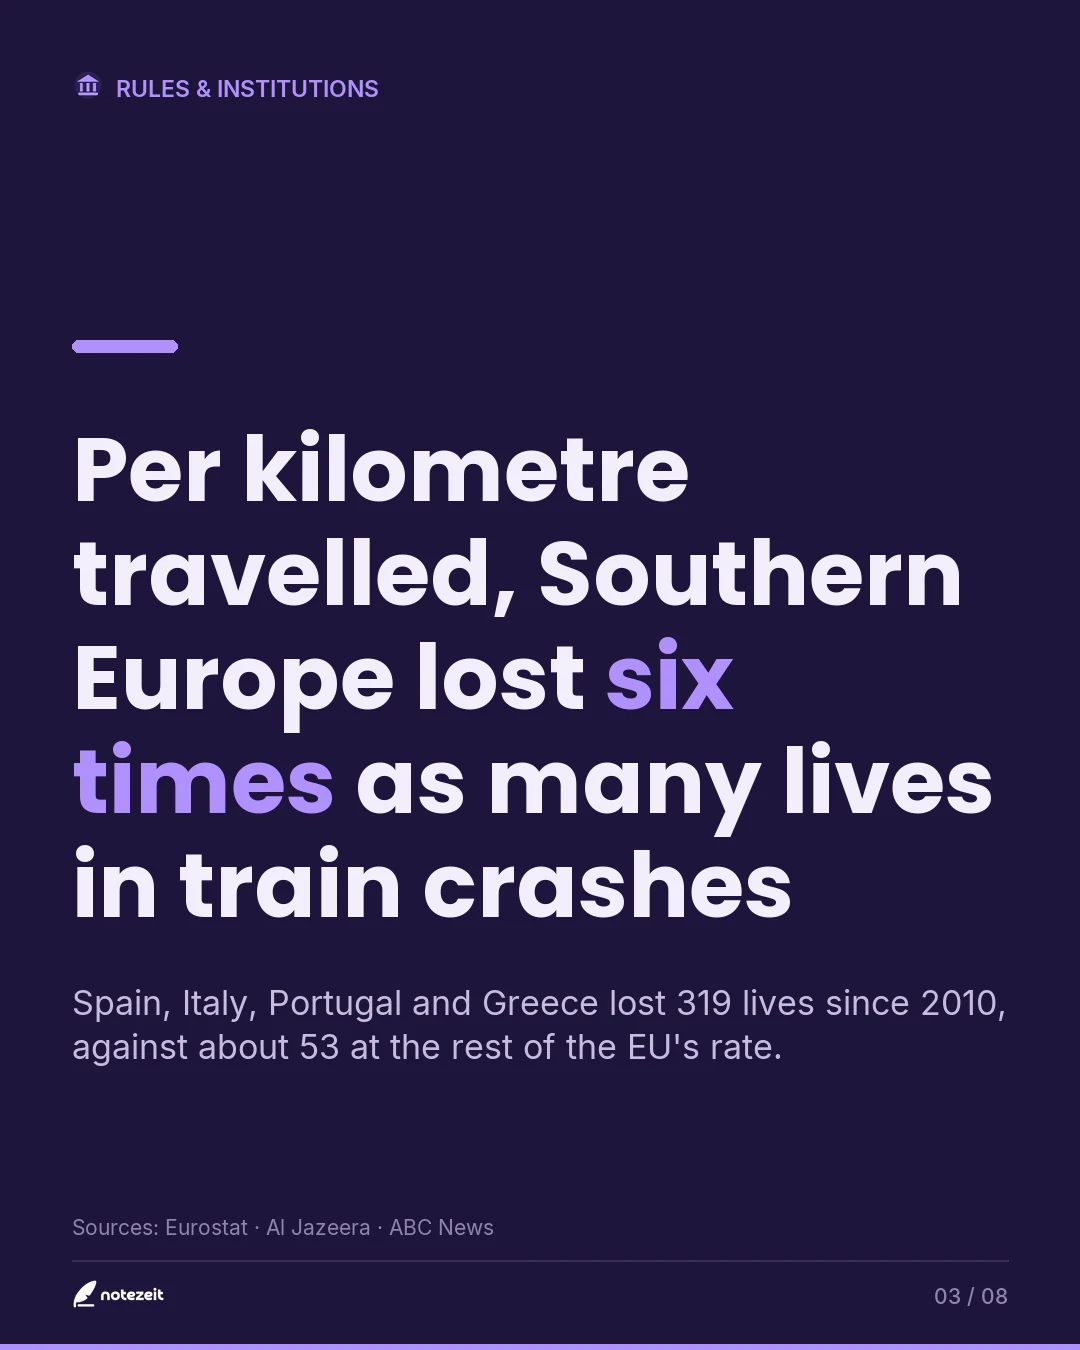
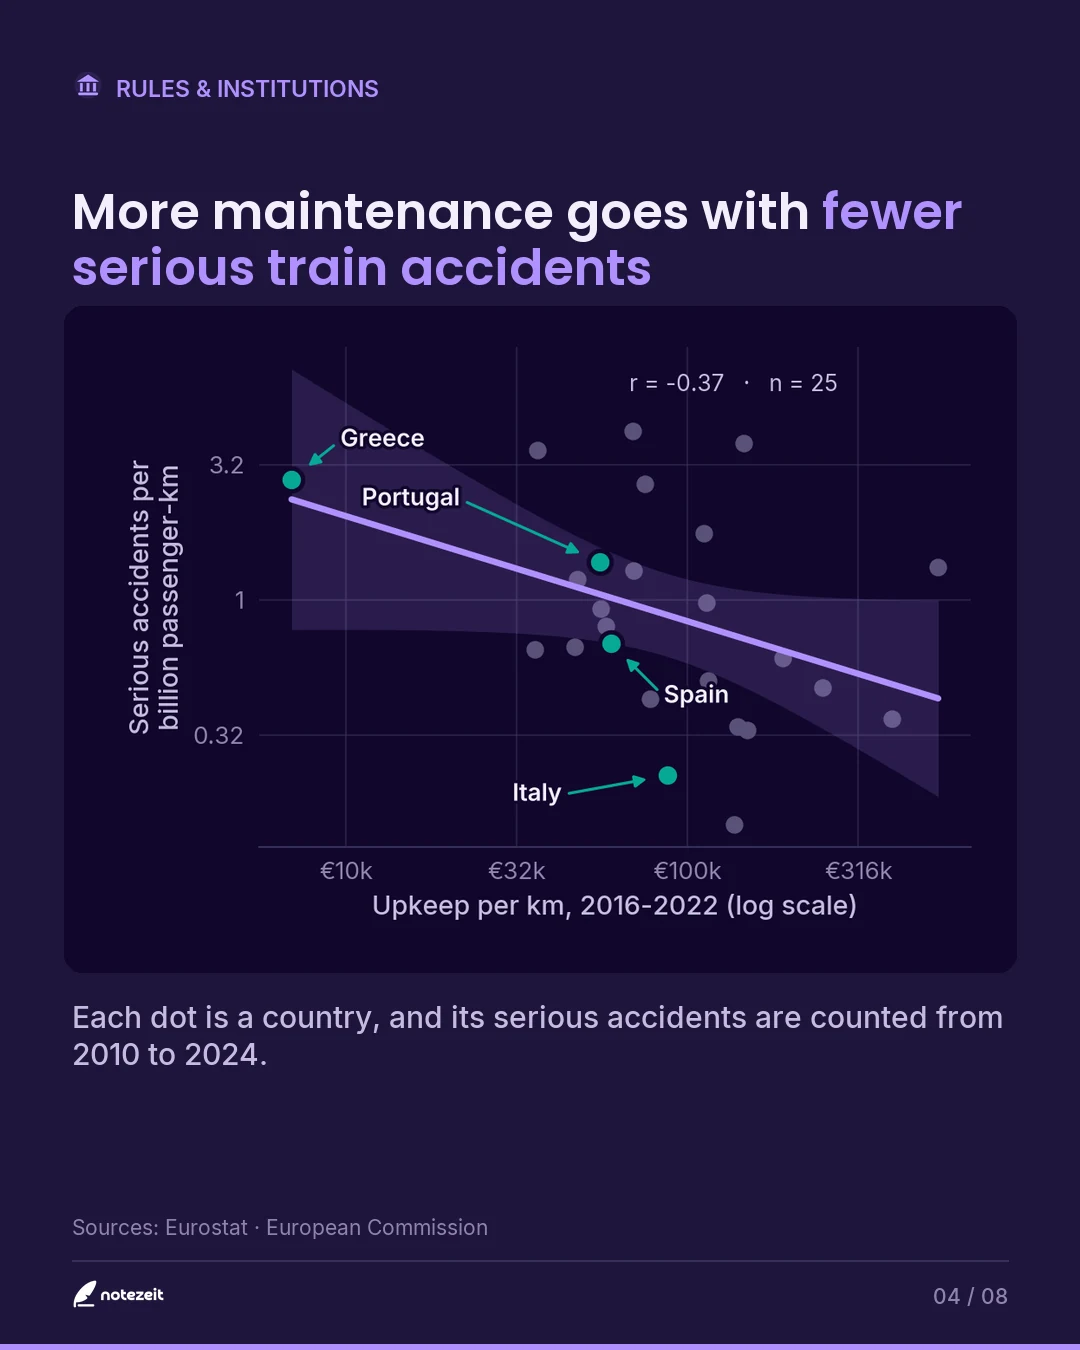
From 2010 to October 2026 the south four lost 319 lives in train crashes, about six times the rest of the EU's rate per kilometre travelled. Meanwhile, across 25 countries, more maintenance goes with fewer serious train accidents. Can Spain, Italy, Portugal and Greece set their priorities right and actually become safer?
What each card says, and where it comes from
Every card of the carousel, in order, with the sources behind it.
- 01
Cover
Southern Europe spends 37% less on rail maintenance than the rest of the EU
From Eurostat · European Commission
AI-generated editorial illustration.
- 02
THE WORST CRASHES
The EU's four worst train crashes since 2004 were all in Spain and Greece
From Eurostat · Al Jazeera · Wikipedia · Natural Earth
- 03
THE RISK
Per kilometre travelled, Southern Europe lost six times as many lives in train crashes
From Eurostat · Al Jazeera · ABC News
- 04
THE SAFETY LINK
More maintenance goes with fewer serious train accidents
From Eurostat · European Commission
- 05
PER KILOMETRE
The south four spend about €40,000 less a year maintaining each kilometre of railway
From Eurostat · European Commission
- 06
WHERE THE MONEY GOES
The south four put a little less money into rail, and far less of it into maintenance
From Eurostat · European Commission
- 07
THEIR OWN BUDGETS
Every year, the south four kept the least of their budgets for maintenance
From Eurostat · European Commission
- 08
THE BOTTOM LINE
Southern Europe's rail maintenance gap is about priorities, not poverty
From Eurostat · European Commission
Sources
For each source, what it supports in this story and what it cannot tell us.
ES11
Eurostat, price level indices, civil engineering works (prc_ppp_ind, PLI_EU27_2020, A050203)
- What it supports
- What the same track work costs in each country (EU-27 = 100), so euros of upkeep compare at equal prices
- What it cannot tell us
- A price level for civil engineering in general, not for railway work alone
Read on 31 October 2026
EC01
European Commission, Ninth report on monitoring development of the rail market, data package (9th RMMS package data and figures, 2025)
- What it supports
- Figure 12: each country's 2022 infrastructure spending split into maintenance, renewals, upgrades and new infrastructure (the upkeep share); Figure 10, the EU-27 totals by year (the kill condition); Figure 17, high-speed spending by type, and Figure 15, spending per line-km (post hoc, the record's numbers checked)
- What it cannot tell us
- Data to 2022 from the member states' rail market monitoring returns; categories are each infrastructure manager's; the sheets list countries in rank order, so the upkeep share's order was seen before its test (brief, amendment 1)
Read on 31 October 2026
EC04
European Commission, Seventh report on monitoring development of the rail market, package data and figures (2021)
- What it supports
- Figure 11: each country's 2018 split into maintenance, renewals, upgrades and new infrastructure; Figure 10, the EU-27 totals by year, 2011-2018
- What it cannot tell us
- Romania absent; categories are each infrastructure manager's
Read on 1 November 2026
RS08
Local reproducible analysis, third registration: four years of upkeep and deaths to 2026
- What it supports
- Each country's upkeep per kilometre at equal prices and per €1,000 of public spending in 2016, 2018, 2020 and 2022 and their four-year means; the groups typical and pooled; the opening number; train-accident deaths and passenger-km to 31 October 2026, the extra deaths and the links across countries
- What it cannot tell us
- Chosen after the results and registered before computing; 2022 reproduces RS06 and RS07; 2025-2026 deaths from the record, a floor
Read on 1 November 2026
ES02
Eurostat, "Rail accidents victims by type of accident and category of persons involved" (tran_sf_railvi), 2006-2024
- What it supports
- Deaths in train collisions, derailments and fires, every country and year since 2006: the list of major crashes
- What it cannot tell us
- From the European Union Agency for Railways' common safety indicators; a country-year can hold more than one accident
Read on 31 October 2026
AJ01
Al Jazeera, "What we know about Spain's second high-speed rail tragedy this year", 29 October 2026
- What it supports
- Toledo: "At least 68 people were killed and about 80 injured"; a computer failure "knocked out LZB, the main signalling system"; an "inexplicable" order from the control centre; the line "is Spain's only high-speed route still using LZB, which dates from the line's opening in 1992"; "Adif was awarded a 52-month contract in 2021 to replace it with the European Union's standard signalling system, but the work is still under way"; Adamuz "killing 46 people"
- What it cannot tell us
- News explainer two days after the crash; the count was still rising (Ara reported more than 70 on 30 October)
Read on 31 October 2026
WP02
Wikipedia, pages and coordinates of the named crashes (Crevalcore 2005, Studénka 2008, Viareggio 2009, Halle/Buizingen 2010, Merano 2010, Hordorf 2011, Szczekociny 2012, Santiago de Compostela 2013, Bad Aibling 2016, Andria-Corato 2016, Tempi 2023)
- What it supports
- The name, date and place of the crash behind each major country-year, for the map
- What it cannot tell us
- Every page's date checked by RS01; never used for a count
Read on 31 October 2026
NE01
Natural Earth, 1:50m Admin 0 – Countries, v5.1.2
- What it supports
- The country outlines on the map
- What it cannot tell us
- Public domain; a layout, not data; vendored in 05_content/assets/maps/
Read on 31 October 2026
ES08
Eurostat, passengers transported (rail_pa_total, million passenger-km)
- What it supports
- How many people use the trains and how far they ride: the denominator of accidents and deaths per passenger
- What it cannot tell us
- Belgium only to 2011, Hungary 13 years, Poland 15
Read on 31 October 2026
AB01
ABC News (US), "'Inexplicable' order probed as cause of train crash that killed at least 69: Official", 29 October 2026
- What it supports
- Toledo: "At least 69 people were killed after two trains collided on Spain's Madrid-Seville high-speed line on Wednesday, officials said"; a 74 from the Interior Ministry "later revised that number downward to 69 dead"
- What it cannot tell us
- A broadcaster reporting officials' figures; the record's count for Urda
Read on 3 November 2026
ES04
Eurostat, "Rail accidents by type of accident" (tran_sf_railac), 2006-2024
- What it supports
- Significant train accidents (collisions, derailments, fires) by country and year, for the accident rate and its trend
- What it cannot tell us
- Used from 2010, the first comparable year
Read on 31 October 2026
ES12
Eurostat, general government total expenditure (gov_10a_main, MIO_EUR, S13, TE)
- What it supports
- All public spending by each country, each year, so its rail infrastructure money can be put against it
- What it cannot tell us
- National accounts, so it covers central, regional and local government and social security; the members' 2022 values add to the EU-27 total exactly. Rail infrastructure money is the infrastructure managers' spending, which EU grants and track charges also pay for, so the two make a ratio, not a budget line; added after the results
Read on 31 October 2026